The Dashboard answers three questions: how many leads came in, where they came from, and how many people started a form but never sent it. One date range drives every number, chart and list on the page, and every card says which period it covers, so you never compare this week with last month by accident.
Where to find it:
Click AiX Forms in the WordPress sidebar. The Dashboard is the first tab and opens on the last 30 days.
Picking a date range:

The range bar at the top holds seven buttons: Today, Yesterday, 7 days, 30 days, 90 days, This year and Lifetime. Click one and the whole page reloads for that period.
For any other period, use the Custom row:

- Pick the first day in the From box.
- Pick the last day in the To box. That day is included.
- Click Apply.
If you pick the dates the wrong way round, the plugin swaps them for you. The line under the range bar always says what you are looking at, for example "Showing every form, in the last 30 days", and reminds you that dates and times are in your site's timezone.
Looking at one form:
When you have more than one form, a dropdown on the right of the range bar says All forms. Pick a form and every number below covers that form only. You can also click a form's name in the Entries by form list further down.
The number cards:
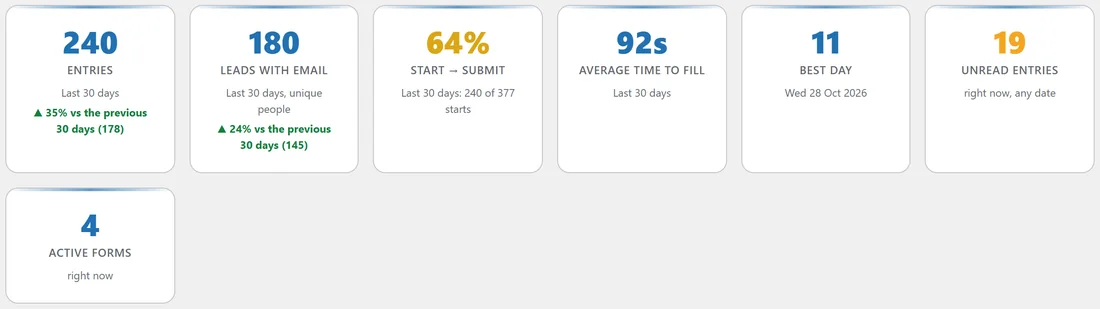
- Entries: how many submissions arrived in the period.
- Leads with email: unique email addresses. Someone who sent three forms counts once.
- Start to submit: of the visitors who started typing in a form, how many sent it. Under it you see, for example, "240 of 377 starts".
- Average time to fill: the average seconds between the form appearing and the visitor sending it.
- Best day: the busiest day in the period, with its date. For Today and Yesterday it shows the best hour; for long periods the best week or month.
- Unread entries: how many entries nobody has opened yet, from any date. Click the card to see them.
- Active forms: how many forms are live right now. Click it to see them. This card is hidden when you look at one form.
Under Entries and Leads with email, a green or red line compares the period with the one before it, for example "35% vs the previous 30 days (178)". Today is compared with yesterday, This year with the same days last year, and Lifetime has no comparison.
The entries chart:
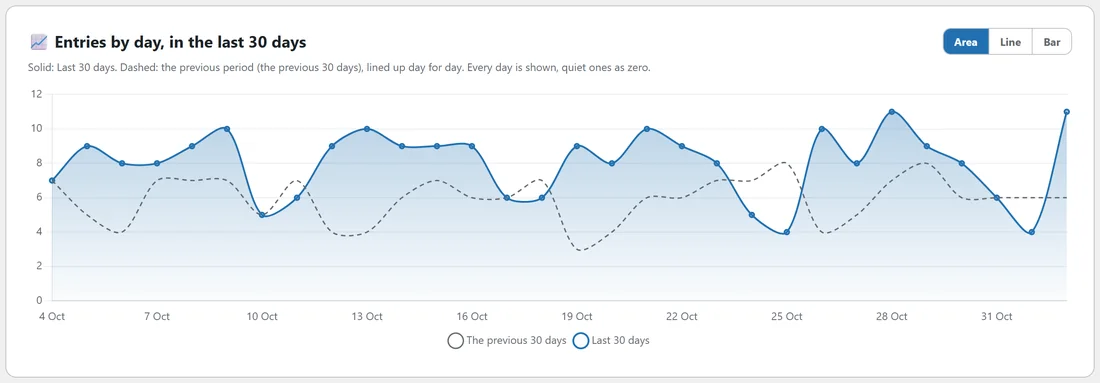
The big chart shows entries day by day for the period. The solid line is the period you picked, the dashed line is the period before it, lined up day for day. Every day is shown, quiet ones as zero, so a gap in your leads is easy to spot. Use the Area, Line and Bar buttons to change the style.
For Today and Yesterday the chart goes hour by hour. Ranges longer than 120 days switch to weeks, and very long ranges to months.
Which days and what time:
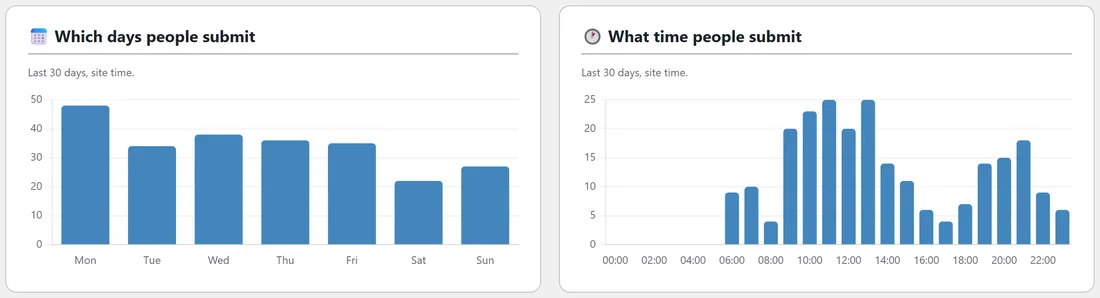
Two bar charts show which days of the week and which hours of the day people send your forms, in your site's time. Northfield Renovations gets most entries on Mondays, and mostly between 9:00 and 13:00, so that is when someone should be ready to answer.
Where your leads come from:
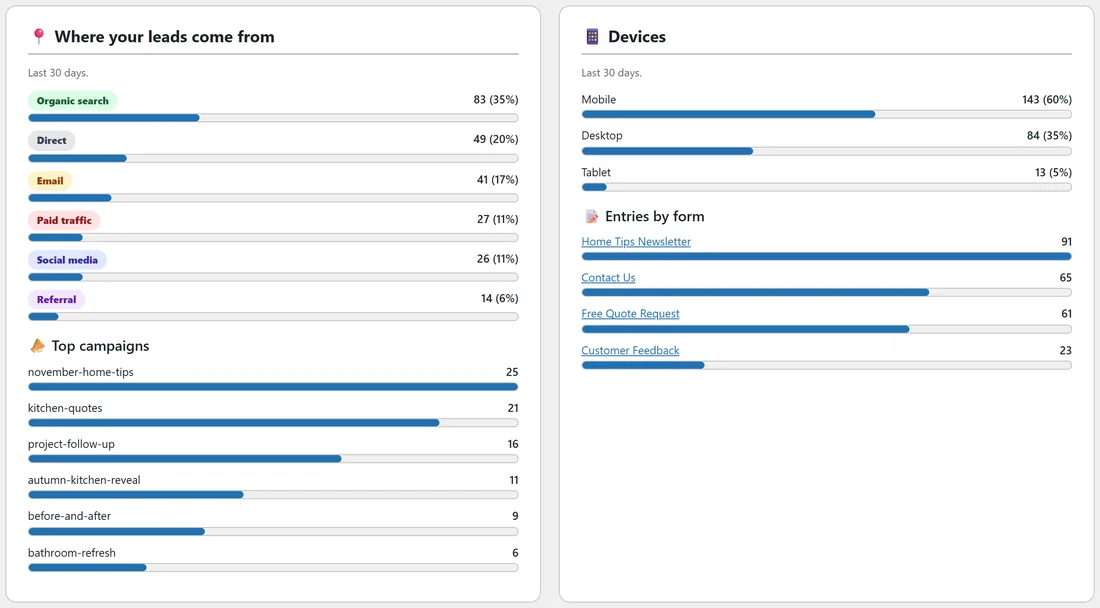
Every entry is sorted into one traffic source: Organic search, Paid traffic, Social media, Email, Referral or Direct. Each gets a bar with its count and share. Under it, Top campaigns lists the ten utm_campaign values that brought the most entries.
On the right, Devices splits entries into mobile, desktop and tablet, and Entries by form ranks your forms. Click a form name to see the Dashboard for that form only.
Your forms:
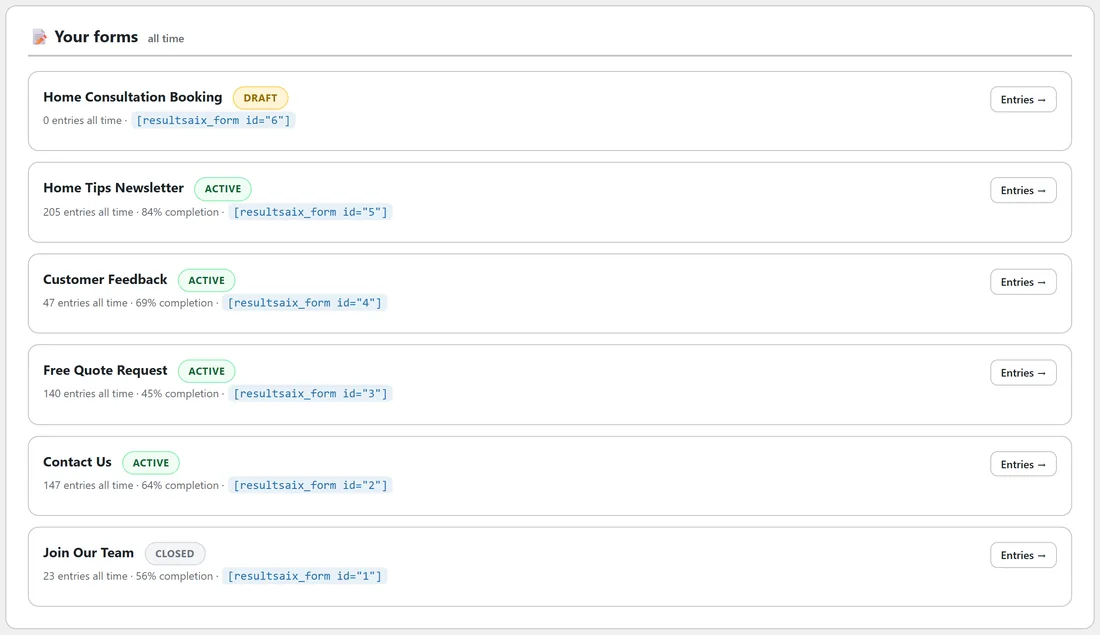
At the bottom, Your forms lists up to eight forms with their status, entries all time, completion rate and shortcode, plus an Entries button for each one. These numbers are always all time.
A real example:
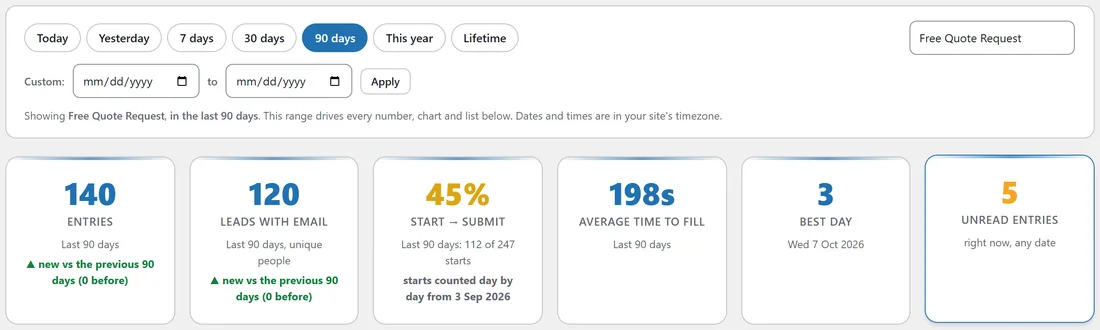
Dana at Northfield Renovations opens the Dashboard on a Monday morning. The last 30 days show 240 entries, up 35%, and 180 unique leads. Organic search brought 83 entries, email 41 and paid traffic 27. The kitchen-quotes ad campaign brought 21 entries. She picks Free Quote Request from the dropdown and switches to 90 days: 140 quote requests, 45% of the people who start the quote form send it, and they take 198 seconds on average. That tells her the quote form is long, and worth a closer look on AI Insights.
Reading the change line:
- A green line with an up arrow means more than the period before; a red line with a down arrow means fewer.
- The number in brackets is the period before, for example (178).
- "new vs the previous 30 days (0 before)" means the period before had none, for example a brand new form.
- "no change" means both periods had the same count.
How the ranges work:
- Every range is made of whole days in your site's timezone, so the chart and the cards always add up.
- 7, 30 and 90 days include today. 30 days on 2 November runs from 4 October to 2 November.
- This year runs from 1 January to today, and is compared with the same days of last year.
- Lifetime starts on the day of your first entry and has no comparison. The line under the range bar says "since" that date.
Which bucket the chart uses:
- One day (Today, Yesterday, or a custom single day): by hour.
- Up to 120 days: by day.
- Up to about two years: by week, each week starting on a Monday.
- Longer: by month.
Monday morning routine, step by step:
- Open the Dashboard on 7 days.
- Check Entries and Leads with email against the week before.
- Look at Where your leads come from, and see whether one channel jumped or dropped.
- Click Unread entries and answer anyone still waiting.
- Switch to 30 days and look at Top campaigns to see which links are working.
- Pick your most important form in the dropdown and check its Start to submit rate.
Comparing two campaigns:
Use a Custom range for each campaign's dates, one after the other, and note the Entries, Leads with email and Top campaigns figures. Because every number follows the range, the two periods compare fairly.
Why some numbers differ:
- Entries counts submissions; Leads with email counts different people. Someone who sends the contact form and the quote form is two entries and one lead.
- Unread entries and Active forms are always "right now", whatever the range.
- Your forms at the bottom is always all time.
Tips:
- The numbers update as soon as a new entry arrives or one is deleted.
- Add utm_campaign to the links in your ads and emails, and Top campaigns fills itself in. See Lead Attribution: Traffic Source, UTM Campaigns, Device And Abandonment.
- Start to submit only counts starts from the day the plugin began counting them day by day. When a range goes back further, the card says the date counting began.